Mini-homework 3 – Visualization by example
Instructions
Obtain the GitHub repository you will use to complete the mini-homework, which contains a starter file named visualization_by_example.Rmd. This mini-homework will help you become more familiar with creating visualizations using R by guiding you through a few simple examples. Read the About the dataset section to get some background information on the dataset that you’ll be working with. Each of the below exercises are to be completed in the provided spaces within your starter file visualization_by_example.Rmd. Then, when you’re ready to submit, follow the directions in the How to submit section below.
About the dataset
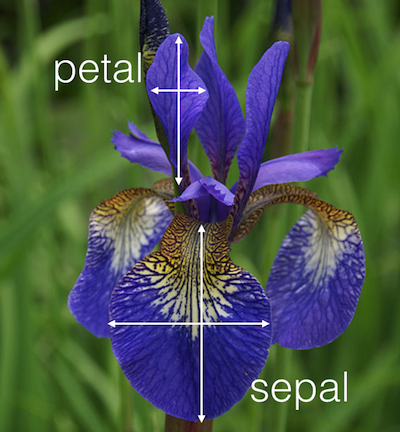
The dataset we are working with in this mini-homework is the iris, a R. A. Fisher’s famous dataset that catalogs measurements of the Sepal and Petal (see below) of three species of iris flowers.
Exercises
Start working on these exercises after you have successfully cloned your repository into RStudio Server.
You should always inspect a new dataset to become more familiar with what it contains. To do this in RStudio, type the following command in your Console window (not in the R Markdown file):
View(iris)Inspect the table that comes up and use it to answer the following questions.
How many rows and columns does this dataset have?
Are the sepal and petal measurements stored as rows or as columns?
What are the three kinds of species of iris flower in the dataset?
Why does the Species column repeat the same words multiple times (put another way, what does each row represent)?
In your starter file visualization_by_example.Rmd, create an R code block by typing:
```{r}

```
You will always need to create an R code block by typing the above if you want to execute code in your R Markdown file. Then, type the following code inside the R code block, like so:
```{r}
ggplot(data=iris) +
  geom_histogram(
    mapping = aes(x = Sepal.Length),
    bins = 30
  )
```
Run the code by either clicking the green “play” button in the upper right corner or, with your cursor still in the block, by pressing Ctrl+Shift+Enter. This should create a plot called a histogram. Look at the Sepal.length column in the table you opened in exercise 1 and compare it with the histogram. Explain what the histogram is doing with the data in this column.
Important!
The backticks for creating the R code block are assumed to be present in all subsequent examples. So if you see this:
1 + 1You should type this in your R Markdown file:
```{r}
1 + 1
```
Let’s figure out what the bins input is doing. Use the code snippet from exercise 2 as a starting point, and change the number to the right of bins to something larger than 30, and then something smaller than 30. You should end up with two plots. Compare the plots and explain what the bins = input controls.
Starting again with the code snippet in exercise 2, modify it to read as follows:
ggplot(data = iris) +
  geom_histogram(
    mapping = aes(x = Sepal.Length, fill = Species),
    bins = 30,
    alpha = 0.5,
    position = "identity"
  )
Run the block and look at the output. What did adding fill = Species do? How does this change the way you interpret the visualization?
A good way to figure out how R works is to experiment with inputs. What happens if you change the value of alpha = 0.5 (keep it between 0 and 1). What happens if you remove the input position = “identity”? What happens if you replace it with position = “dodge”? What does it change in your output?
Hint
When moving the input, be careful with the commas! A comma should separate each input, and there should not be any trailing commas.
Let’s wrap up by making a scatterplot, which allows us to see how two different variables (columns) change at the same time. Type in and execute the following code in an R code block:
ggplot(data = iris) +
  geom_point(
    mapping = aes(
      x = Sepal.Length,
      y = Petal.Width,
      color = Species
    ),
  )
Describe any patterns that you observe in the plot.
How to submit
To submit your mini-homework, follow the two steps below. Your homework will be graded for credit after you’ve completed both steps!
Save, commit, and push your completed R Markdown file so that everything is synchronized to GitHub. If you do this right, then you will be able to view your completed file on the GitHub website.
Knit your R Markdown document to the PDF format, export (download) the PDF file from RStudio Server, and then upload it to Mini-homework 3 posting on Blackboard.
Cheatsheets
You are encouraged to review and keep the following cheatsheets handy while working on this mini-homework: