Lab 11 – Mining the social web
Instructions
Obtain the GitHub repository you will use to complete the lab, which contains a starter file named lab11.Rmd. This lab shows you how to access the Twitter API using the rtweet package and how to analyze the harvested data. Carefully read the lab instructions and complete the exercises using the provided spaces within your starter file lab11.Rmd. Then, when you’re ready to submit, follow the directions in the How to submit section below.
Gathering data using an API
Most of the datasets you’ve worked with during this course were stored in files that were easy to load using R. While this is convenient, it isn’t always the case that a dataset will already have been gathered for you and you will need to collect the data yourself. For example, if you want to investigate current and ongoing trends taking place on the internet, you will need to find a way to extract relevant data from one or more websites. The general practice of gathering data from a website is called web scraping and the amount of effort needed to scrape any given webpage depends on many factors. That’s why it’s always worth your while to check and see if a website has an application programming interface, also known as an API, which provides a convenient and structured way to access and interact with website data. Twitter is an example of website with an API that is used by app developers and data scientists alike. The recommended way to access the Twitter API from R is by using the tidyverse-compatible package called rtweet, which we will learn how to use during this lab.
rtweet setup instructions
To access data from the Twitter API for this lab, you will need to configure your RStudio environment so that Twitter recognizes you as an authenticated user. There are two ways to configure rtweet so that it works on RStudio Server, both of which are detailed below.
Method 1: Create an App on developer.twitter.com
Important!
This is the recommended method for accessing the Twitter API from RStudio Server. However, it will only work if you have a valid Twitter account and the course instructor has been able to invite you to join the CDS 102 developer team. Unfortunately, there is a known issue where team invites fail for some users and there is no timeline for when this problem will be fixed. If the instructor is unable to send you an team invitation, try following the instructions in Method 2.
This method will have you generate an authentication token by creating a Twitter App on developer.twitter.com. Don’t worry, you’re not actually developing an application, this just happens to be the easiest way to get one of these tokens. Navigate to https://developer.twitter.com/en/apps, login to your Twitter account, and click the Create New App.

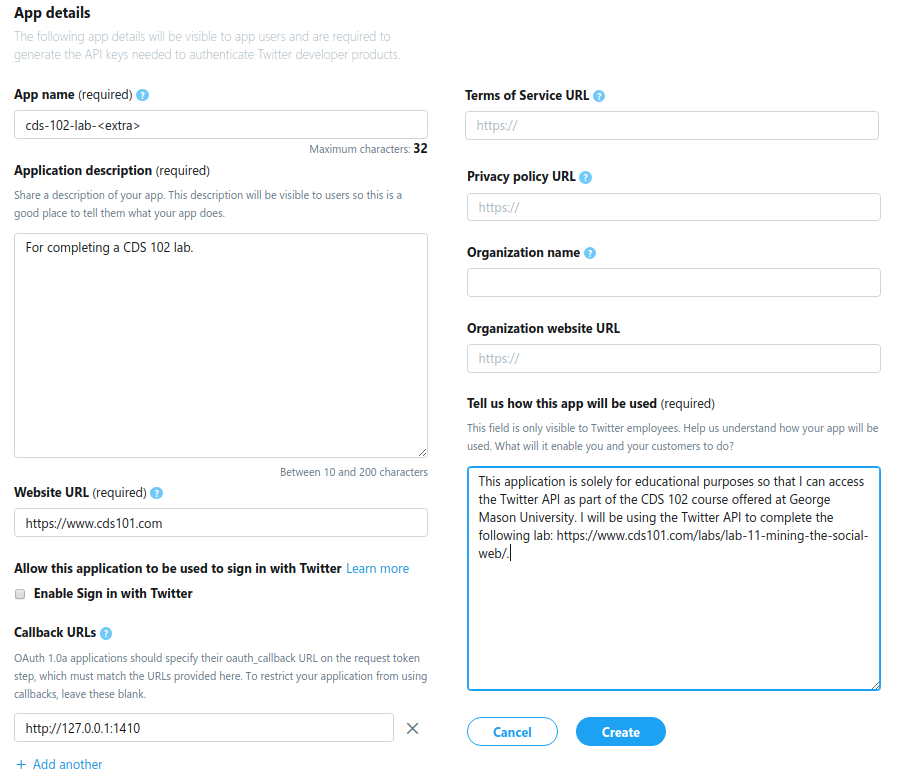
This will open a page where you will enter the necessary information for creating a new app. Fill in the form using the information provided below. If a form field is not listed, then that means you should leave it blank.
Naming your Twitter App
In the App name field, replace <extra> with a sequence of letters or numbers of your choosing.
App name: cds-102-lab-<extra>
Application description: For completing a CDS 102 lab.
Website URL: https://www.cds101.com
Callback URLs: http://127.0.0.1:1410
Tell us how this app will be used: This application is solely for educational purposes so that I can access the Twitter API as part of the CDS 102 course offered at George Mason University. I will be using the Twitter API to complete the following lab: https://www.cds101.com/labs/lab-11-mining-the-social-web/.
After filling in all the above information, the form will look as follows,

To create the Twitter App, click the Create button.
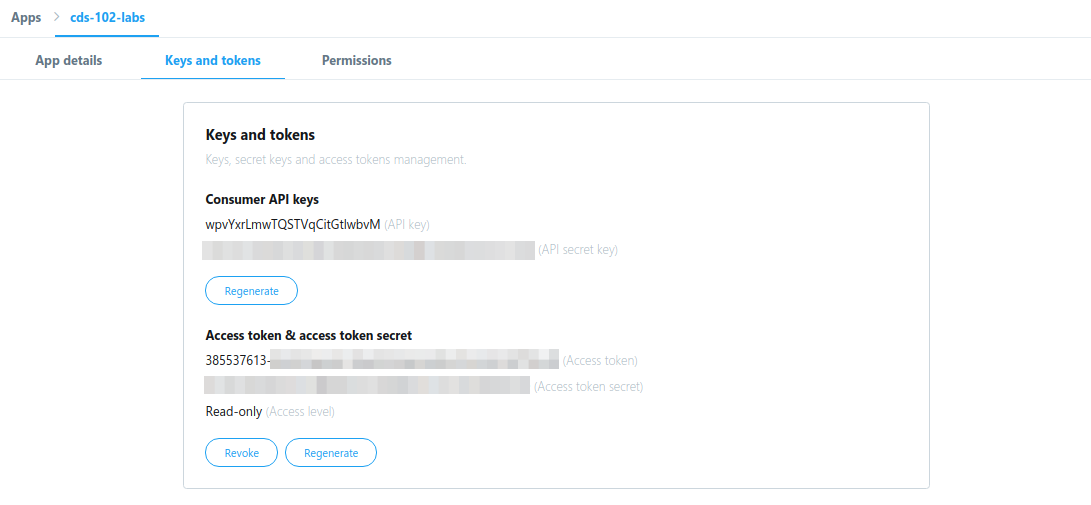
After creating the app, click the tab labeled Keys and tokens to retrieve your consumer API keys and access tokens. The page will look something like this,

Important!
Your consumer API keys and access tokens should never be shared with another person or committed to a GitHub repository.
Leave the Keys and tokens page open in a browser tab for the time being and switch over to RStudio Server. Activate the project for this lab, then in the Console pane run the following to start the rtweet configuration script,
source("configure_rtweet.R")
configure_rtweet_rstudio_server()
You will be prompted to enter the following information,
Enter your twitter app name:
Enter your twitter consumer api key:
Enter your twitter consumer api secret key:
Enter your twitter access token:
Enter your twitter access token secret:
The twitter app name should exactly match the app name you entered in the application creation form. The rest of the information can be copied and pasted directly from the Keys and tokens page you have open in your other browser tab. When you have entered all the information, you will be asked to confirm that what you entered is correct. If it is, type y and press Enter and the script will take care of the rest for you. Proceed to the section titled fetching data about users, their followers, and friends.
Method 2: Generate a token using your local computer
Important!
This method should only be used if you are unable to complete Method 1.
This method requires that you have R and RStudio installed on your local computer. Consult the course syllabus for a list of what applications you will need to install. Once you have everything installed, launch RStudio and run the following in the Console pane to install the R packages you will need,
install.packages(c("remotes", "fs", "readr", "dplyr", "usethis", "httpuv", "rtweet"))After the package installation completes, run the following in the Console pane to generate an authentication token on your local computer,
source(url("http://data.cds101.com/configure_rtweet.R"))
generate_token_on_local_computer()
You will see the following message display in your Console pane,
ℹ Generating Twitter token, login to your Twitter account and authorize rtweet.
Requesting token on behalf of user...
Waiting for authentication in browser...
Press Esc/Ctrl + C to abort
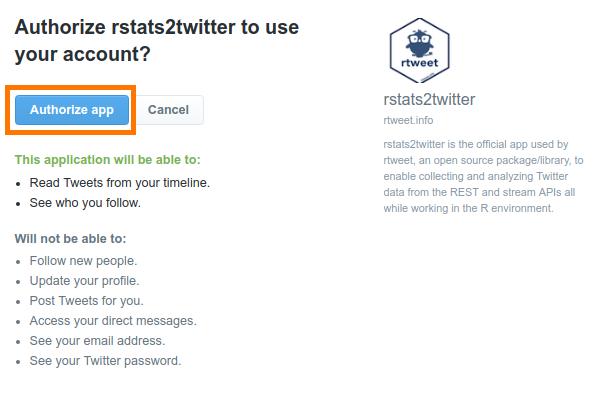
and a new tab will also open up in your default web browser where you will be asked to log into your Twitter account if you aren’t already logged in. You will then see the following authorization message,

Click the Authorize app button and then return to RStudio, where you should see a message in the Console pane that looks as follows,
Authentication complete.
ℹ Your locally generated Twitter token was saved to the following location on your computer:
  '/path/to/twitter_token.rds'
  Upload this token to your home directory on RStudio Server.
ℹ Then, on RStudio Server, activate the project for the 'Mining the Social Web' lab, and run the following in the Console window:
  source("configure_rtweet.R")
  use_uploaded_token_on_rstudio_server()
The line /path/to/twitter_token.rds will be replaced with wherever the script saved your token on your computer. It should be located somewhere in your home folder.
Where is my home folder?
If you are having trouble locating your home folder, watch this video if you are using Windows 10 or read these directions if you are using macOS
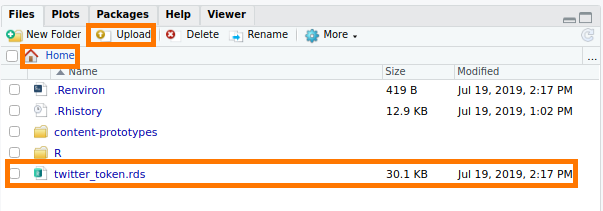
From here we follow the directions printed out to us in the Console pane. Upload the twitter_token.rds file to your home directory on RStudio Server,

Then, on RStudio Server, activate the project for the Mining the Social Web lab, and run the following in the Console pane,
source("configure_rtweet.R")
use_uploaded_token_on_rstudio_server()
If you have uploaded twitter_token.rds to the correct location, the script will take care of the rest. Proceed to the section titled fetching data about users, their followers, and friends.
Fetching data about users, their followers, and friends
There are many things we can analyze on a social media platform like Twitter. Like most things, we will start small by stepping through a basic analysis of a single Twitter account. Our example account will be @CSS_GMU, which is the official Twitter account of the Computational Social Science program in George Mason University’s Computational & Data Sciences Department.
Let’s begin by fetching the basic account information for @CSS_GMU, which we will then save to disk for offline access. We do this so that we don’t have to query the Twitter API (which has rate limits) every time we want to access this information. To get this data and save it, run the following in the Console pane,
lookup_users("CSS_GMU") %>%
  write_rds("user_css_gmu.rds")
This will write a file named user_css_gmu.rds in your project directory that contains the information we just queried. To load the data you just requested, place the following code block in your R Markdown file,
user_css_gmu <- read_rds("user_css_gmu.rds")
Now let’s take a look at the information we just gathered about @CSS_GMU. Perhaps we can learn something about the account just by looking at the different variables.
Let’s focus on the following variables associated with the @CSS_GMU account,
user_css_gmu %>%
  users_data() %>%
  select(
    account_created_at,
    description,
    favourites_count,
    followers_count,
    friends_count,
    location
  ) %>%
  glimpse(width = 200)
What do these variables describe and why might they be interesting to know?
Next, run the following to get a full list of the variables for the account,
user_css_gmu %>%
  users_data() %>%
  names()
What other variables do you see that would be of interest to a data scientist?
On social media platforms such as Twitter, we can learn a lot about an individual user by looking at the people that user follows (we’ll call these friends) as well as the people that follow the user (we’ll call these followers), and by studying the attributes and behaviors that emerge when these users interact with one another. Let’s see how this works in practice.
We need to fetch the friends and followers of the @CSS_GMU account using the
get_followers()andget_friends()functions from rtweet. Like before, we will save the results to a file so that we don’t need to keep sending queries to the Twitter API. Run the following in the Console pane,get_followers("CSS_GMU") %>% pull(user_id) %>% lookup_users() %>% write_rds("css_gmu_followers.rds") get_friends("CSS_GMU") %>% pull(user_id) %>% lookup_users() %>% write_rds("css_gmu_friends.rds")Let’s pause for a moment. Do you understand what the above code is doing? Using the skills you’ve developed over the semester, figure out what
get_followers()andget_friends()are doing and explain it. Thepull()function is then grabbing the contents of a column named user_id and passing it intolookup_users(). Figure out what thelookup_users()function is doing in the above code, and explain it.After you write your explanations, create a code block that loads the data you just saved to the .rds files. Assign the followers data to the variable css_gmu_followers and the friends data to the variable css_gmu_friends. Use the last code block from Exercise 1 for reference.
Visualizing Twitter data
One of the conveniences of the rtweet package is that it returns Twitter data in the tibble format, so it is fully compatible with our tidyverse tools. Let’s work through a few examples of what you can do to analyze this data.
One of the questions we can ask of our data is if there is a relationship between how often @CSS_GMU’s followers tweet and the number of followers they have. While we’re at it, we can also ask: are the more active and connected accounts more or less likely to list a website link on their profile page?
Use the following code to create a scatter plot that shows the number of followers an account has as a function of the number of tweets it has posted,
css_gmu_followers %>%
  users_data() %>%
  ggplot() +
  geom_point(
    mapping = aes(
      x = statuses_count,
      y = followers_count,
      color = is.na(profile_url)
    )
  ) +
  scale_x_log10() +
  scale_y_log10() +
  coord_equal()
Notice that we have set our plot to have a log-scale on both axes. Why would we want to do that? Also, explain what a TRUE value for
is.na(profile_url)means.Next, based on what you see, explain what this graph tells us about the accounts that follow @CSS_GMU. Would you expect to see the same kind of trend if you sampled another Twitter account at random and looked at its followers? If so, why would you expect that? If not, what is it about the @CSS_GMU account that makes it different?
The account creation dates for @CSS_GMU’s friends and followers is another kind of data that can contain meaningful patterns and be of interest to us.
Use the following command to visualize the distribution of account creation dates for followers of @CSS_GMU,
css_gmu_followers %>%
  users_data() %>%
  ggplot() +
  geom_histogram(
    mapping = aes(x = account_created_at),
    bins = 20
  )
Describe any interesting features you notice in the distribution and provide a possible explanation for why those features might be there. Is there anything about the account @CSS_GMU itself that explains why the distribution of account creation dates of its followers looks this way?
Of course, it wouldn’t make sense for us to interact with the Twitter API if we don’t grab some actual tweets! To request tweets for a specific account, we use the get_timeline() function.
Fetch and save all the tweets by the @CSS_GMU account by running the following command in the Console pane,
get_timeline(user = "CSS_GMU", n = 500) %>%
  write_rds("css_gmu_all_tweets.rds")
Then, place the following code block in your R Markdown file to load the data you just requested,
css_gmu_tweets <- read_rds("css_gmu_all_tweets.rds")
A tweet history such as the one we just collected is an example of time series data. A common method for summarizing time series data is to create a timeline plot, which in this context would let us know if there are periods of time where a Twitter account was more active.
Use the following code to create a timeline plot for @CSS_GMU’s monthly tweeting frequency that goes all the way back to the day the account was first created,
css_gmu_tweets %>%
  tweets_data() %>%
  ts_plot(by = "months") +
  theme(plot.title = element_text(face = "bold")) +
  labs(
    x = NULL,
    y = NULL,
    title = "Frequency of @CSS_GMU Twitter statuses since account creation",
    subtitle = "Twitter status (tweet) counts aggregated using one-month intervals",
    caption = "\nSource: Data collected from Twitter's REST API via rtweet"
  )
You’ll notice that there’s a cyclical pattern to the tweet frequency for this account. Write down a plausible explanation for why this account would have a cyclical tweeting history.
Choose your own adventure
Now it’s your turn to tell a story. Pick a Twitter account, any account, and explore it using the tools that were just introduced to you. Your exploratory analysis should include no less than 4 separate plots that you interpret and weave into a coherent story about your chosen account. This is an open-ended lab report, so go ahead and have some fun with it!
The grading will be heavily weighted towards this section and what you submit for this part of the lab.
Note
While your story should start with one Twitter account, you are welcome to branch outward by looking at the attributes of the account’s friends and followers to enrich and extend your analysis. You are welcome to use any of the available functions in rtweet, even if they weren’t shown in the exercises.
How to submit
To submit your lab, follow the two steps below. Your lab will be graded for credit after you’ve completed both steps!
Save, commit, and push your completed R Markdown file so that everything is synchronized to GitHub. If you do this right, then you will be able to view your completed file on the GitHub website.
Knit your R Markdown document to the PDF format, export (download) the PDF file from RStudio Server, and then upload it to Lab 11 posting on Blackboard.
Cheatsheets
You are encouraged to review and keep the following cheatsheets handy while working on this lab:
Credits
This lab is licensed under a Creative Commons Attribution-ShareAlike 4.0 International License. Lab instructions and exercises originally created by Joe Shaheen for CDS-102. Updates to exercises and instructions for compatibility with the rtweet package by James Glasbrenner.

